
SERENIMiND: Empowering Addiction Treatment for Patients and Clinicians
SERENIMiND assists clinicians and therapists in making real-time clinical decisions by utilizing patients' craving and trigger data, which is continuously collected through a patient app.
SereniMind Patient App

The SERENIMiND Patient App utilizes the Desires for Alcohol Questionnaire (DAQ), which asks participants to rate the intensity of their desire to drink alcohol or use drugs at specific moments throughout the day. This data is then transferred to the Clinician App, featuring a clinician’s dashboard that provides a comprehensive assessment of patients’ craving intensity and the triggers for alcohol and drug use.

Additional Features
-
Progress Tracking: Monitor recovery journey and therapy milestones with intuitive visualizations.
-
Personalized Care Plans: Receive tailored recommendations based on patient's unique needs and progress.
-
24/7 Access to Resources: Explore a library of evidence-based articles, exercises, and mindfulness activities to support patient's mental well-being.
-
Seamless Communication: Securely message with clinician, track appointments, and stay connected.

SERENIMiND Clinician App – Dashboard View
The SERENIMiND Clinical App features a clinician’s Dashboard that offers a thorough assessment of patients’ craving intensity and the triggers for alcohol and drug use.
After the patient craving data is uploaded to SERENIMiND clinician app, the information is processed and displayed in graphs to help therapists view and analyze trends and patterns in craving and trigger data. The data reports can be reviewed, saved, printed, and emailed.


Personalized Recovery Insights for Enhanced Therapy Outcomes
The Clinician Dashboard leverages key metrics like Craving Intensity, Positive and Negative Reinforcement Cravings, Relapse Risk, and Engagement in Therapy to empower therapists with actionable insights for personalized care.
Craving Insights and Trigger Analysis for Targeted Interventions

The app provides a detailed analysis of daily craving intensity, highlighting peak periods, driven by emotional triggers.
Visual graphs, including hourly intensity breakdowns and trigger frequency charts, enable therapists to identify patterns and root causes of cravings.

A detailed analysis of the frequency of craving and trigger chart enables clinicians to quickly make informed therapy decisions and develop effective intervention strategies.
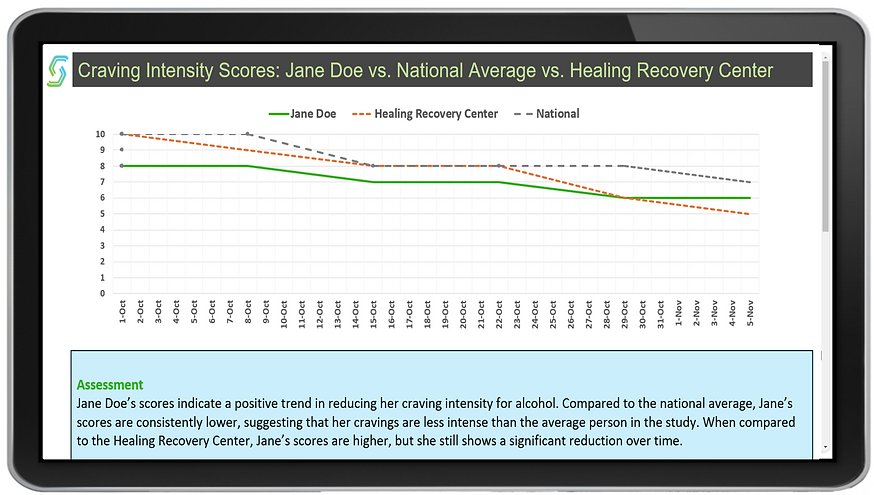

Tracking Recovery: Patient's Scores compared to National and Center Averages
The comparative line charts provide visual representation of craving intensity trends over time. The chart uses distinct lines to track changes in craving intensity, offering a clear picture of patient's recovery journey measures up against broader trends.
Thank you for taking the time to review the SERENIMiND patient app and clinician dashboard. Your feedback will guide us in ensuring the tool meets the needs of clinicians and empowers patients in their recovery journey.